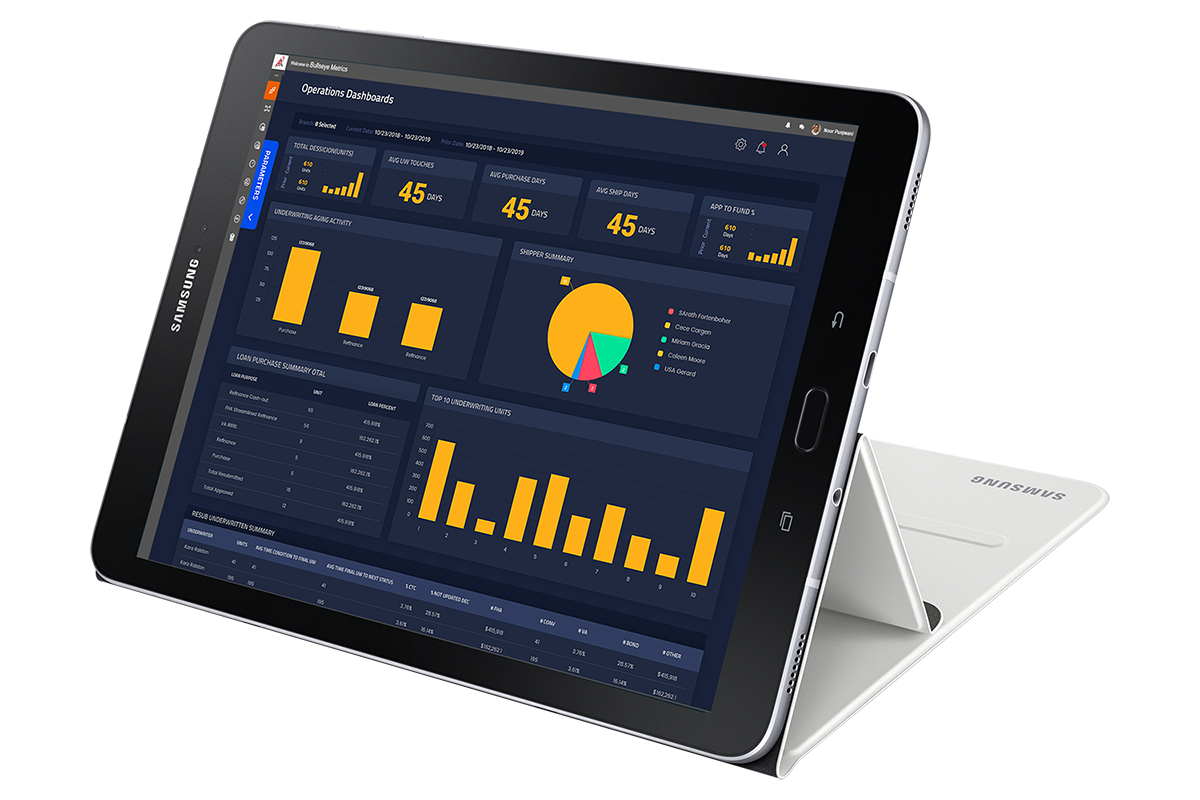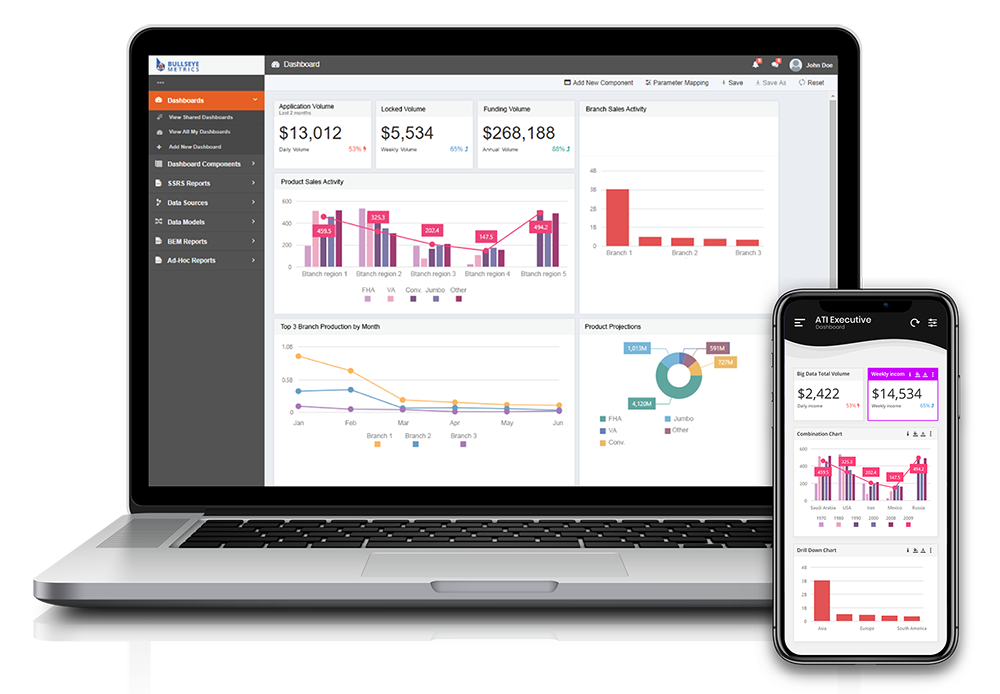
Bullseye Metrics follows simple 3 steps to visualize your data
STEP1
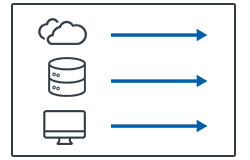
Collect your data
You can connect to all leading databases and other data sources in Bullseye Metrics like XLS, CSV, SQL Server and the same can be done with a few clicks.
STEP2
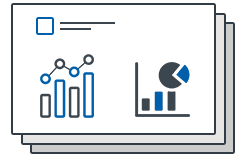
Make data stories
Jump into your data and generate insights with simple tools. Save those insights as beautiful, interactive reports that reveal the stories hidden in your data.
STEP3
Gather & Visualize
Generate personalized dashboards and keep up on metrics that matter to you. Visualize all your data and empower your organization to make quick, confident decisions.
Bullseye Metrics puts powerful data
at your fingertips
Analytics & Reporting
Visualize your valuable data and your organization performance. You can even analyze your entire organization’s data comparing others in your industry with the Bullseye Metrics.
